Look ma, no Hass!
I've been tinkering with ESPHome recently, trying to add some air quality sensors to my household. There's a lot of good tutorials out there, but they almost universally have one thing in common: they assume that the end goal is Home Assistant integration.
Which is cool piece of software, but I don't have any use for it right now. All I want is to monitor few air quality parameters, send the metrics to metrics DB and render nice graphs in Grafana which I already have for monitoring other stuff.
So the purpose of this article is to cover the parts that are missing in the other tutorials out there using my sensor project as practical example.
Plan🔗
So how should all this work without Home Assistant orchestrating everything behind the scenes?
Here's my desired flow of data:
- ESPHome device will monitor air and submit metrics over MQTT
- Mosquitto will work as MQTT server receiving messages with sensor data
- Telegraf with MQTT input plugin will subscribe to these updates, parse the messages into numerical data and ship these to the metrics DB
- Grafana will then query this data and draw nice graphs.
I've picked most of these services simply because I already have them deployed for other purposes. There are alternatives for every layer, you just need to pick and choose tools matching your monitoring stack.
ESPHome🔗
Initial setup🔗
In many tutorials out there you start by installing ESPHome plugin in your Home Assistant. We're not going to do that, instead we'll head straight to getting started with command line page and because I have Docker already deployed, I'm going to use that.
So let's create directory for our configuration repository and run esphome in it:
# init the repo
git init esp-sensors
cd esp-sensors

# run esphome in docker
docker run -ti --rm  -v $PWD:/config -p 6052:6052 -e ESPHOME_DASHBOARD_USE_PING=true esphome/esphome:2023.6

# alternatively for folks without docker, follow esphome installaton steps then:
esphome dashboard .
For Docker users it should be pretty self-explanatory. The only tricky part is the ESPHOME_DASHBOARD_USE_PING=true that tells esphome to use pings rather than broadcasts to test whether devices are online. (alternatively use host networking)
I'll be using Docker going forward, but it should be possible to follow along with manual installation of esphome - just imagine the above docker command simply mapped to esphome and with default command being dashboard . if none is provided.
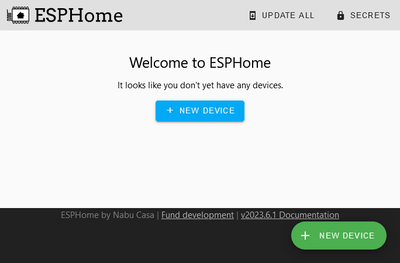
Now open browser at http://localhost:6052/ and.. 🎉 we have the dashboard, that you no doubt saw in many tutorials out there except this time is not embedded in Home Assistant UI:
We're going to resist that tempting + New Device button and instead organize the code ourselves.
Code organization🔗
The plan is to have multiple sensors around the house. To prevent code repettition we can use packages, this will also help structure this post so that we can go package by package. Let's start with the base file:
# air_sensor_1.yaml
---
substitutions:
  device_name: air_sensor_1
  friendly_name: Air Quality Sensor 1
This is pretty basic and far from complete. We've just set couple substitutions, but this is actually the only difference between the sensor configuration. Now let's start with individual packages:
Basic configuration package🔗
Let's create packages directory with basic.yaml file in it. This will hold basic board configuration:
# packages/basic.yaml
---
substitutions:
  device_name: unknown
  friendly_name: Unknown Device

esphome:
  name: ${device_name}
  friendly_name: ${friendly_name}
esp32:
  board: esp32dev
logger:
ota:
  password: !secret ota_password
This package contains basic esphome configuration and the board setup. (You need to change the board type to refpect your HW) It also enables logging and OTA updates once the devices are online. Notice how the package declares its own substitutions so that it still works even if the variables for device_name and friendly_name aren't declared in the main file. In our case these values will be replaced with substitutions set in air_sensor_1.yaml. There's also OTA password set, that is pulled from secrets file, more on that later.
It's perhaps worth noting, that this configuration does not contain the Native API component, that is frequently present in tutorials out there. This would be the API that Home Assistant is using to talk to this device. However in our case, there is no Home Assistant and in default API system configuration device will assume failure if no client is connected. This would cause the device to self-restart every 15 minutes assuming something has failed. Keep that in mind if you want to experiment with the API.
Now we just need to include the package into the main config:
# air_sensor_1.yaml
---
substitutions:
  device_name: air_sensor_1
  friendly_name: Air Quality Sensor 1

packages:
  basic: !include packages/basic.yaml
WiFi connectivity🔗
With basics out of the way, let's configure Wi-Fi. First create the package:
# packages/wifi.yaml
---
substitutions:
    device_name: NONAME

wifi:
  ssid: !secret wifi_ssid
  password: !secret wifi_password
  ap:
    ssid: "${device_name} Fallback Hotspot"
    password: !secret wifi_fallback_password
captive_portal:
This is pretty basic WiFi component configuration that connects to predefined network and obtains the IP via DHCP. It also has fallback AP configuration in case it fails to connect to your network. It will create its own Wi-Fi letting you to connect and upload fixed configuration. Handy if the device is not easily accessible once deployed. Notice again the use of substitutions and secrets.
Let's add this package to our main config file:
# air_sensor_1.yaml
... SNIP ...
packages:
  basic: !include packages/basic.yaml
  wifi:  !include packages/wifi.yaml
At this stage we already have enough configuration to compile and push this firmware to device. It would connect to our WiFi and would respond to pings. This is however not very useful, so let's resist the temptation (Or not? It's up to you!) for now and add sensors.
Sensors🔗
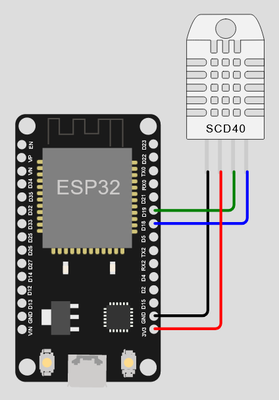
In my case, I'm using SCD40 gas sensor module connected over I2C. This part is very specific to my hardware and also depends on which pins are used for the sensor, but you can no doubt adapt this to reflect your configuration. Here's how mine is connected using 3.3V power from the esp32 board and pins 18 and 19 for I2C:
So let's configure the package based on that using the scd4x sensor component:
# packages/scd40.yaml
---
sensor:
  - platform: scd4x
    co2:
      name: "CO2"
    temperature:
      name: "Temperature"
    humidity:
      name: "Humidity"
i2c:
  sda: GPIO18
  scl: GPIO19
Next we can include it:
# air_sensor_1.yaml
... SNIP ...
packages:
  basic: !include packages/basic.yaml
  wifi:  !include packages/wifi.yaml
  scd40:  !include packages/scd40.yaml
And that's enough to get us sensor readings periodically printed in the logs. We're missing one last step..
MQTT🔗
As per my plan, we want to ship these metrics to MQTT. Fortunately Esphome has just the right component for this. Let's create separate package again. This one is going to be pretty simple, we just need to point to a broker and provide credentials:
# packages/mqtt.yaml
---
mqtt:
  broker: mqtt.example.com
  username: mqttuser
  password: !secret mqtt_password
The above is enough to let our device connect to MQTT server and to start publishing the measured values in a pretty reasonable format. The MQTT allows for further customization, but the defaults are very reasonable. Now we can just add the package to the packages list which gives us quite small main file configuration in its full glory:
# air_sensor_1.yaml
---
substitutions:
  device_name: air_sensor_1
  friendly_name: Air Quality Sensor 1

packages:
  basic: !include packages/basic.yaml
  wifi:  !include packages/wifi.yaml
  scd40:  !include packages/scd40.yaml
  mqtt:  !include packages/mqtt.yaml
For adding more devices with same sensors we can just copy the file and update substitutions. Neat! The last thing left is the secrets file which we referenced multiple times already. We'll drop all these into single packages/secrets.yaml:
# packages/secrets.yaml
---
mqtt_password: REDACTED
wifi_ssid: REDACTED
wifi_password: REDACTED
wifi_fallback_password: REDACTED
ota_password: REDACTED
I'm not going to cover installation of MQTT, there's no special configuration required other than setting up credentials for your devices. If you use Docker, there's an official image with instructions available for Mosquitto which is pretty simple to use and very lightweight MQTT broker.
To avoid committing secrets file by mistake, we'll also add it to the .gitignore together with some extra stuff that does not need to be pushed to git:
# .gitignore

# Do not commit compiled binaries and cache
/.esphome/
# Do not commit secrets
secrets.yaml
Keep in mind that you need to keep the secrets backed up somehow or have easy way of restoring them.
Initial firmware upload🔗
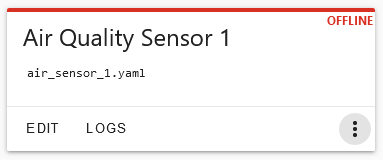
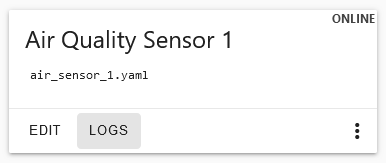
If everything went well, we should see our sensor appear in ESPHome dashboard:
For the first upload, we'll have to use USB, once the device is online, further updates can be done over Wi-Fi. I'm huge fan of Firefox and perhaps you're too, but for this step we need (as of writing this article) one of Chrome, Edge or Opera, because these support Web Serial API. As I mentioned, it's once-off thing, any browser will work for the subsequent OTA updates.
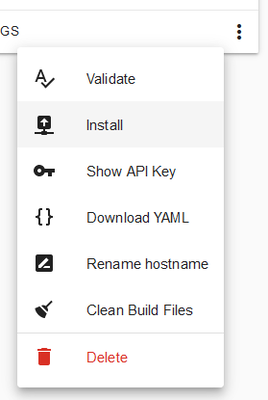
Click Install in the three dot menu:
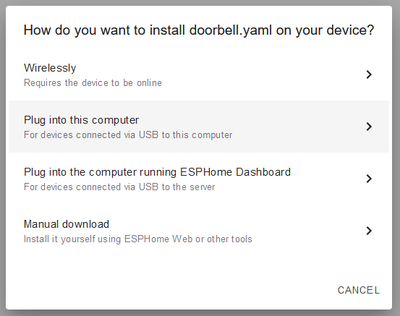
Then plug the device into your PC's USB and select Plug into this computer:
Confirm the serial port from the list in the browser and follow the process. Be patient, at some stage the firmware actually needs to be compiled. Depending on your connectivity and hardware, this can take couple of minutes.
This process will vary depending on which board you're using. Some don't have serial adapter built in and you'll need to provide it yourself. Some might require certain button to be pressed, etc. In my case it's pretty simple affair as I have everything built in.
Once done, the device should boot the new firmware, connect to Wi-Fi and show up online.
Success!
We should also see the measurements appearing in MQTT. For MQTT observation I recommend excellent MQTT Explorer:
If you don't see any measurements appearing, debug using the ESPHome Logs button to investigate what's going on. This too can use serial connection (using Web Serial) or Wireless if device shows as online.
Telegraf🔗
Now that we have our measurements in MQTT, let's get them to metrics database using Telegraf. This is not the only option, it's just something I use already. I'm also not going to focus on unrelated parts of the configuration and I'm assuming you have Telegraf set up already in a state where it ships metrics to whatever metrics DB you might use. (If you haven't picked up one yet, I quite like VictoriaMetrics.)
For details and extra options, see mqtt_consumer input plugin documentation. Here's my MQTT configuration dropped to /etc/telegraf/telegraf.d/mqtt.conf:
[[inputs.mqtt_consumer]]
    servers = ["tcp://mqtt.example.com:1883"]
    data_format = "value"
    client_id = "telegraf"
    username = "username"
    password = "REDACTED"
    topics = [
      "+/sensor/co2/state",
    ]
[[inputs.mqtt_consumer]]
    servers = ["tcp://mqtt.example.com:1883"]
    data_format = "value"
    data_type = "float"
    client_id = "telegraf-float"
    username = "username"
    password = "REDACTED"
    topics = [
      "+/sensor/temperature/state",
      "+/sensor/humidity/state",
    ]
It's very basic configuration. You can see the MQTT topics we're subscribing to. The + sign matches any single element of the path. This is where our device name is and by using wildcard, we can add more devices without having to make any changes in Telegraf configuration. We're only interested in the sensor/<kind>/state subpath as this is where actual values are published. Also of note is that we have set up two separate consumers. One is of (default) data type integer and the other is set to float. This is important as both temperature and humidity are published with up to two decimal points of accuracy (this is sensor specific) and with the integer value type this would fail parsing.
Assuming we have our metrics DB working and all went well, we can get to the final step.
Grafana🔗
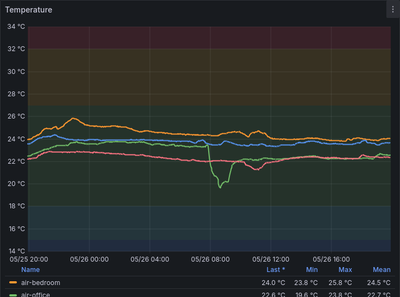
Let's create graph for temperature as an example:
mqtt_consumer_value {topic=~"[-a-z0-9_]+/sensor/temperature/state"}
This gives us nice graph, but the labels are a bit ugly. Fortunately we can parse out the device ID from the topic path using label_replace:
label_replace(
  mqtt_consumer_value{topic=~"[-a-z0-9_]+/sensor/temperature/state"},
  "device",
  "$1",
  "topic",
  "(.*)/sensor/temperature/state"
)
Then we can use {{ device }} as Legend value in Grafana. Neat!
Fin🔗
Adding few of these devices around the house gives me pretty decent environment monitoring without much infrastructure to manage. The setup is rock solid and the ESP devices just work without skipping a beat.
This article is part of Linux category. Last 17 articles in the category:
- On dishwashers and Nix
- My favorite log aggregation service
- Sudo just a bit
- NixOS on Contabo
- Lenovo P500 remote management via serial port
- HTTP 500 - Very internal server error
- My favorite home lab metrics service
- LXC and the mystery of lost memory
- Docker in WSL2 (the right way ++)
You can also see all articles in Linux category or subscribe to the RSS feed for this category.
