My favorite home lab metrics service
Looking at my git history, I've been happily running InfluxDB for years. However nearing the end of 2021, after long time of peaceful coexistence among my monitoring services, some more or less pressing problems emerged:
- The long-term future of InfluxDB
1.xis uncertain, it's pretty clear that I'll have to migrate to2.xin foreseeable future. - Memory usage becomes a bit problematic. Well, that's quite an understatement. The container ran out of memory frequently and I had to bump up the limit couple times already. Despite that, I can't even graph longer time spans without getting InfluxDB OOM killed and it's at this stage by far the most memory intensive service I ran. There are presumably some improvements in InfluxDB
2.xthat could help here.
The solution seems pretty obvious, however in the end this post isn't really about InfluxDB.
The major concern with the InfluxDB update was that this was indeed quite breaking and pretty major change. There is some backwards compatibility with 1.x, however:
- For how long will I be able to rely on it's existence? These days I'd be more comfortable with this, but back then couple months after
2.xrelease, the backwards compatibility felt like migration mechanism rather than long term solution. - There are some minor changes even within this layer. Not major problems, but it still wasn't simple drop-in replacement for me.
The above problems are in big part due to how I store metrics, because I just keep them forever. I also collect a lot of stuff. Mostly because figuring some aggregation feels like too much work (for home lab) and picking specific metrics to store double so. In short, it's not you InfluxDB, it's me. Especially the cardinality. And searching for solutions with the cardinality problem eventually pointed to..
VictoriaMetrics🔗
Frankly, this metrics DB is very much a hidden gem. I'm pretty sure I haven't heard about it before and even usual metrics related search queries won't lead to VictoriaMetrics anywhere near the top of the search page.
However, reading the docs gave me a hope, because it seems to be pretty well optimized for my specific use case. That is, this DB should handle large cardinality way better and can ingest metrics over influx protocol, so I wouldn't have to change that part of my setup at all.
The obvious downside is, that I will have to redo all the dashboards and monitoring I had in Grafana, because the protocol is for ingestion only. But again in light of new Flux query language in InfluxDB, this might be inevitable anyways. (In hindsight perhaps not immediately) Another downside was that I had to figure out some way to migrate the data.
On the plus side, at the time, there was no solid support for Flux in Grafana, while VictoriaMetrics offers Prometheus querying API, which is among the best supported data sources in Grafana - in my experience even better than legacy InfluxDB.
There was enough motivation for me to at least give this a try. I could always fall back to upgrade if things wouldn't work out.
Migration🔗
Preserving (at least some of the) data was pretty important to me. If that turned out to be problematic or impossible, I'd call this a fail and revert to the InfluxDB upgrade as next best plan.
Fortunately, VM folks provide well documented tool exactly for this. In fact, the biggest obstacle here was the InfluxDB side of things as it struggled to fetch all the data without hitting OOM wall. I had to double its memory limit just to do the migration. For this reason I also decided to only migrate last ~20 months worth of history.
Reworking all of the dashboards in Grafana was much more manual affair, but here support for PromQL in Grafana really shines. It was also good refresher for me as I haven't used Prometheus for a while.
Overall the migration turned out to be pretty straightforward and just barely more involved than InfluxDB 2.x upgrade with switch to Flux.
Year later🔗
First of all, I'm truly impressed. I only realized, that I've been running VictoriaMetrics for over a year just because I looked at git history. I had exactly zero issues with it. For home lab, time is the most valuable resource, so well working service that does not need much maintenance is essential.
Now since we're talking about metrics DB, it would be absolutely inexcusable if this post didn't contain any graphs. But let me preface this with a warning. This is somewhat apples to oranges comparison. I haven't migrated all of the metrics (although I did transfer over interesting data with very broad brush, so a huge portion of metrics was migrated) and InfluxDB was collecting data for multiple years before migration. However in terms of cardinality, VictoriaMetrics has likely seen more unique time series than InfluxDB did, because I was ever only adding new ones. I rarely remove stuff.
InfluxDB stats🔗
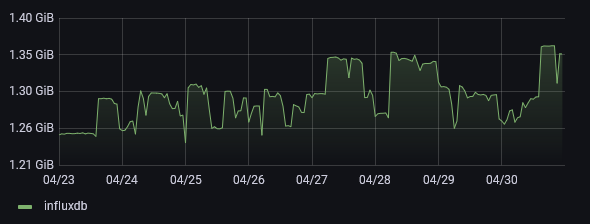
Bellow graphs are from last week of April 2021. At that stage I've been running InfluxDB for about 3 years, so there's about 3 years worth of metrics stored. Unfortunately due to migration, this is as far as I can go for these graphs.
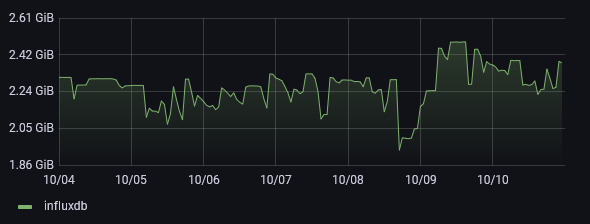
The memory usage was also rapidly getting out of hand - about 6 months later it's approaching double the memory usage as baseline. Bellow graph shows just that - the usage while ingesting data and with some simple monitoring queries. Running a more involved query would push that usage up considerably to the point where it would hit the 5GB limit.
VictoriaMetrics stats🔗
Bellow graphs are last 7 days. At this stage Victoria has been running about 1.5 years, so about half of the InfluxDB service time in the graphs above. But on top of the metrics collected by Victoria itself since being in production there is also the 20 months of history that was migrated - which is why I was able to provide the above graphs. In terms of cardinality, there are additional metrics that I collect now, that weren't collected in 2021 - though this is probably not a major difference.
So again, yes, it's apples to oranges, however in terms of workload and cardinality this is about the same ballpark.
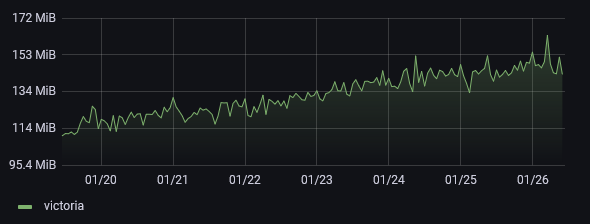
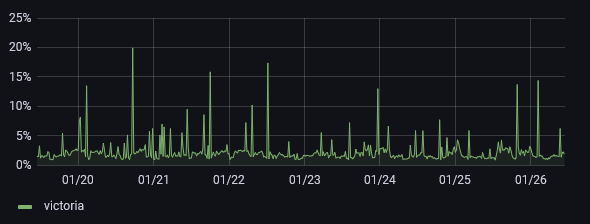
As you can see, the container is hovering at about 10x to 20x less memory usage. And this is still true even when pushing the DB a bit - like digging up metrics from years back to create graphs for this post. I have yet to see this service use more than 350MB memory at peak. Regular operations leave it comfortably under 200MB RAM usage.
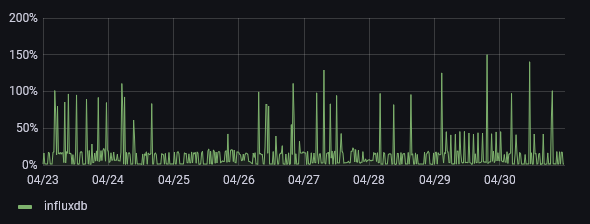
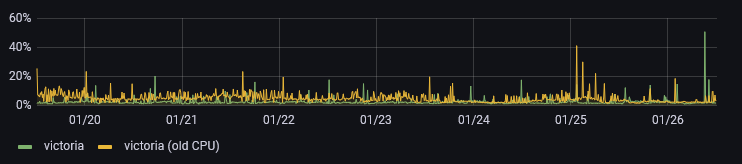
The CPU usage is also somewhat lower. It's worth noting, that the CPU graph is also affected by moving to more energy efficient system with fewer slightly more powerful cores, but lower total performance. The difference isn't substantial:
Final thoughts🔗
Overall, I'm very impressed. I definitely don't want to call out InfluxDB as some bad solution, after all, it has served me very well for years. It's very solid metrics DB. Also there were some improvements in the 2.x series of the product, that would no doubt alleviate some or perhaps all of the issues I was experiencing. In other words, InfluxDB is great choice.
Which really makes VictoriaMetrics even more impressive. The compatibility with multiple ingestion protocols and ability to use Graphite and Prometheus API to query the data is also very nice and might provide good drop-in replacement for something one might already have in production.
I'd advise to at least consider VictoriaMetrics when implementing, improving or replacing metrics collection system.
This article is part of Linux category. Last 17 articles in the category:
- On dishwashers and Nix
- Look ma, no Hass!
- My favorite log aggregation service
- Sudo just a bit
- NixOS on Contabo
- Lenovo P500 remote management via serial port
- HTTP 500 - Very internal server error
- LXC and the mystery of lost memory
- Docker in WSL2 (the right way ++)
You can also see all articles in Linux category or subscribe to the RSS feed for this category.